Context
Imagine yourself...
You’re the IT Security Director at a large fintech company. Your team manages hundreds of privileged identities across cloud platforms, internal systems, and third-party applications.
One day, you receive an urgent alert: a former DevOps engineer’s account—one that should have been deactivated years ago—was used to access sensitive financial data. Worse, the account still has admin-level privileges.
Your company now faces the risk of millions in damages from potential data breaches, compliance violations, and reputational harm.
Context
Real-life scenarios
Such cyberattacks have happened recently!
- Geisinger Healthcare (2023), when a former employee retained access after termination and took personal records of 1.2 million patients
- Century21 Payroll Systems (2019), when an IT admin created a "superuser" account and stole payroll data
Context
Enter Ambient Security
Ambient Security is a 2-year-old startup that addresses such problems. They aim to mitigate the risk of privilege account takeovers.
It's like stopping a thief from having a digital master key to your company.
I had the privilege of working on Ambient Security's very first product, the Identity Network Graph. This feature gives a visual representation of all accounts tied to a common identity, highlighting exposures and risks (like unusual access behaviors or old unused accounts).
However, our design partner had problems distinguishing between the objects on the graph and determining the appropriate next steps.

"[ The Identity Network Graph ] looks like random important things right now - is there a way for me to correlate the items?"
Desired project outcomes
Develop an experience that makes our users feel confident they’re addressing the most critical issues in their system by....
- Introducing a modern design system (typography, color, spacing, etc.)
- Showing users what exactly is the problem and how to resolve it
RESEARCH
Competitive Analysis, Rapid Iterations
To tackle this challenge, I studied from cybersecurity platforms such as Wiz and Rezonate to understand best practices and opportunities for differentiation. I rapidly ran through iterations of mockups with the team, which consisted of the CPO, a FE Eng, and 1 design partner.

early explorations
The evolution of the Identity Network Graph
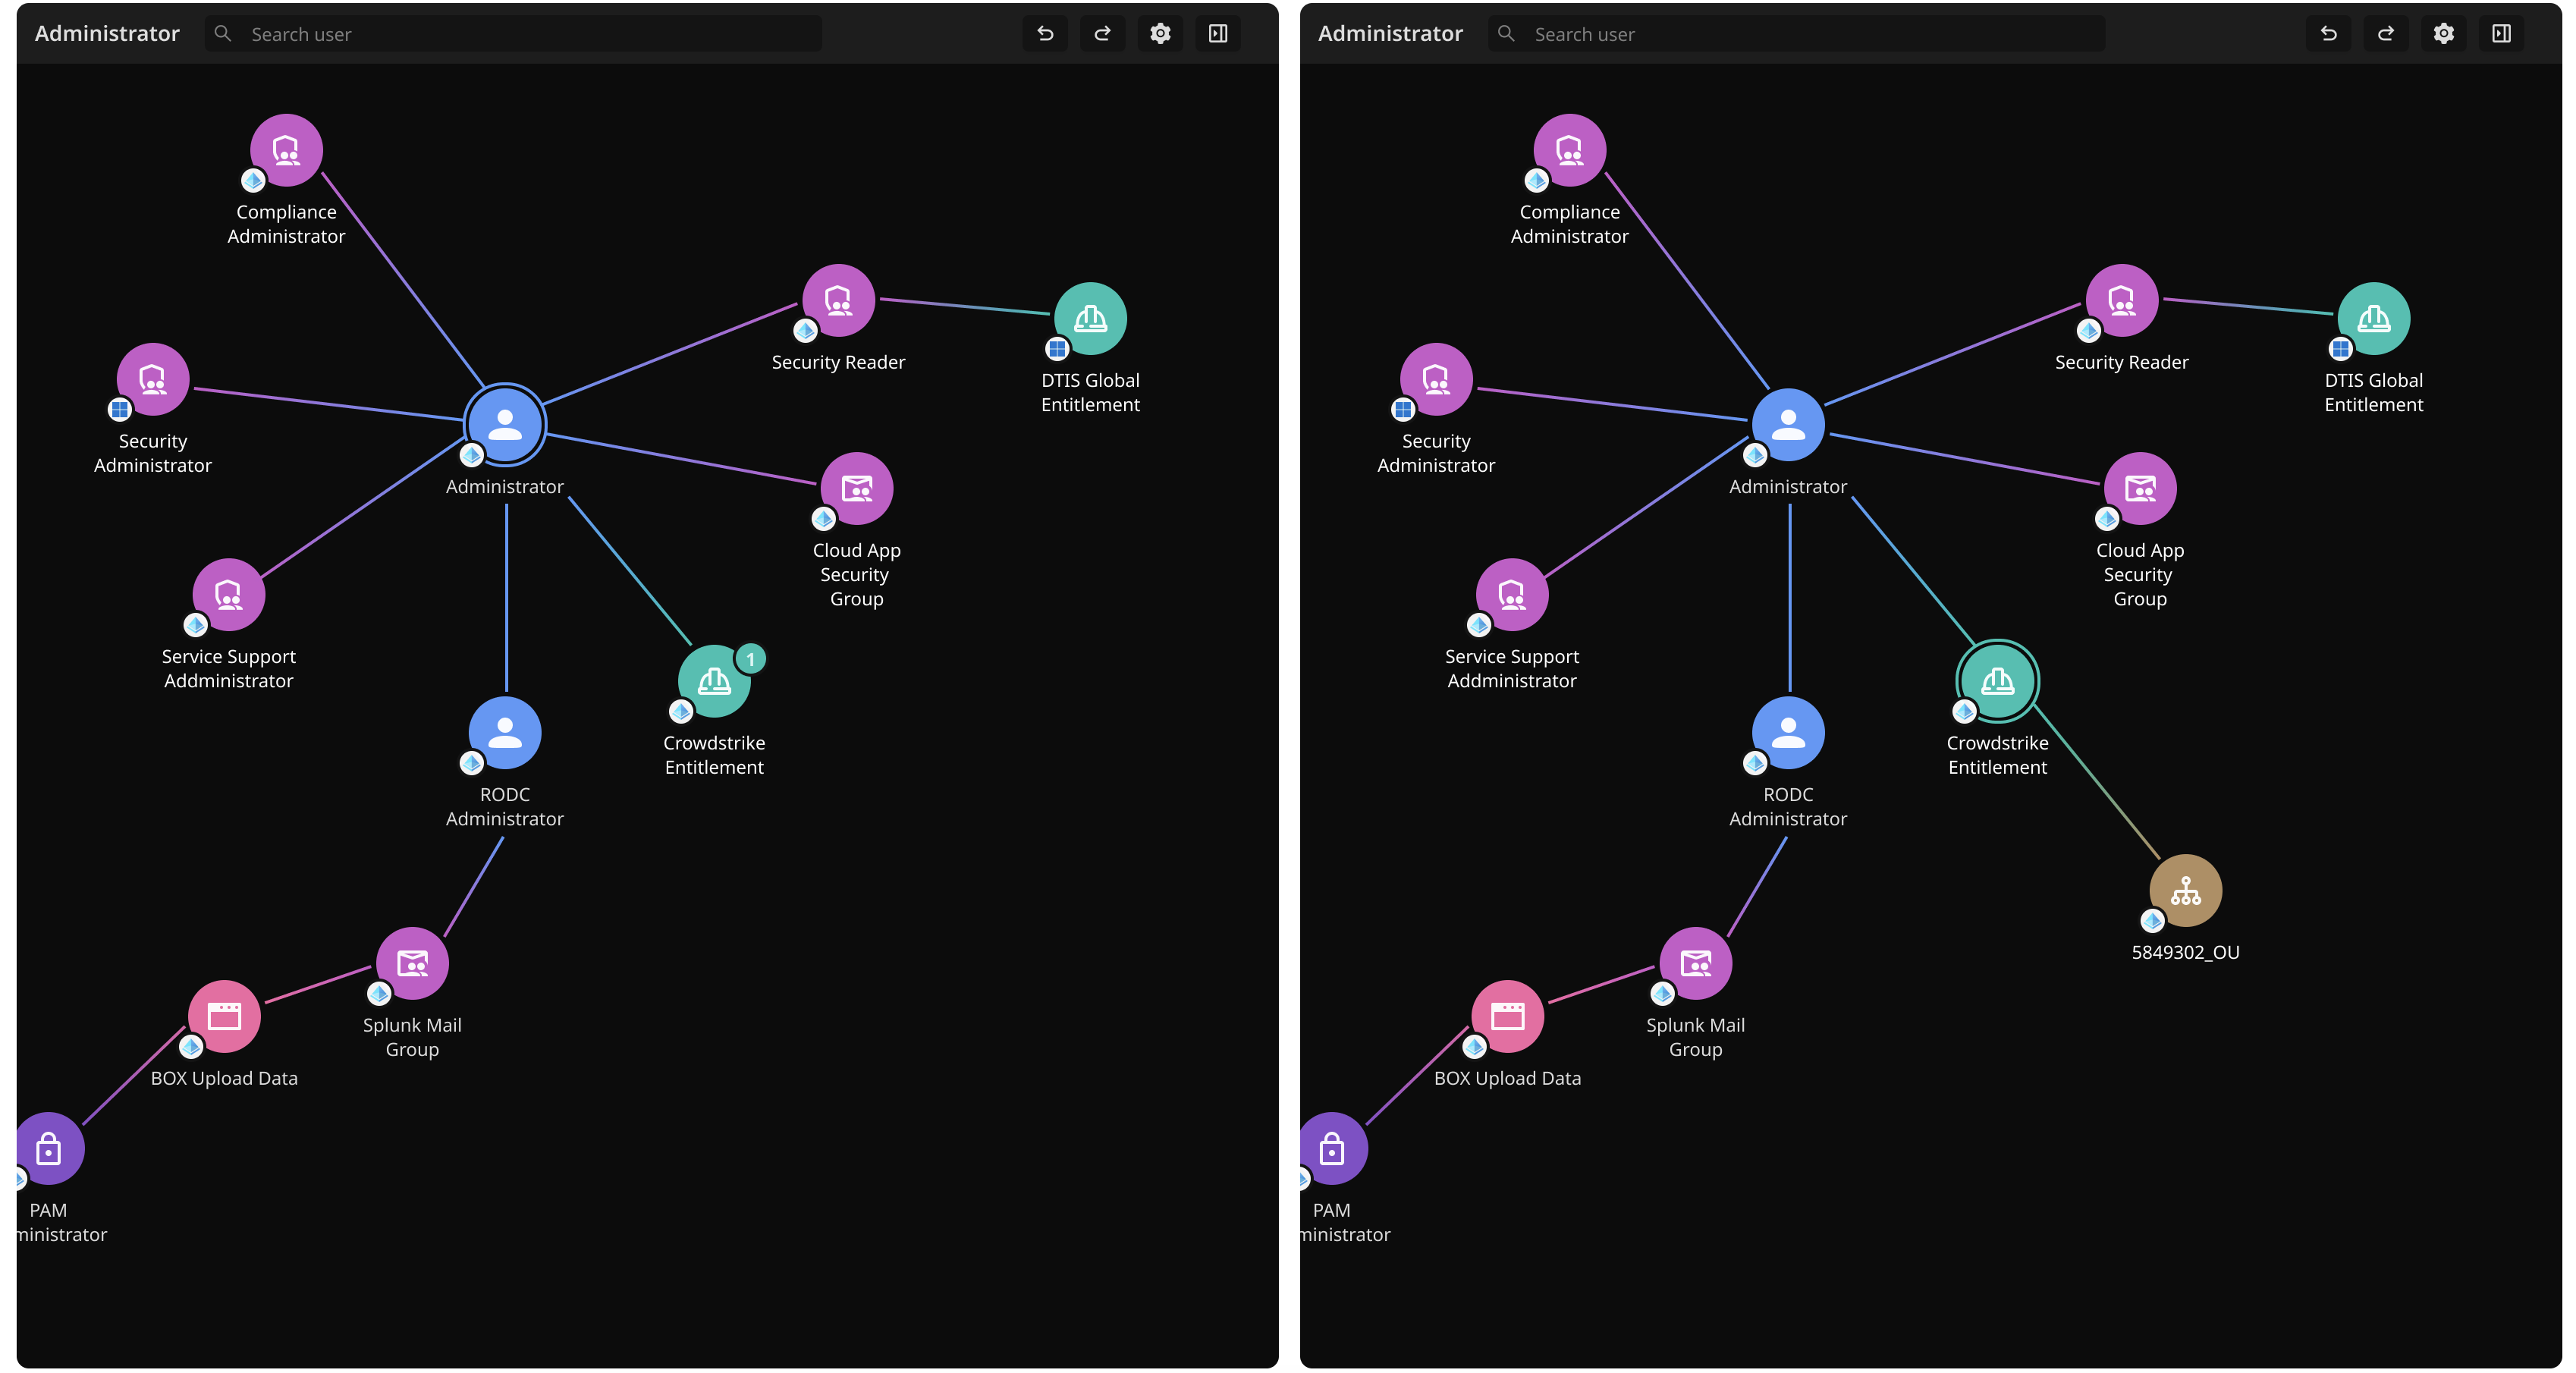
The identity graph evolved through multiple iterations as I worked to balance clarity, usability, and visual hierarchy.
My first approach was to surface findings inline with the graph. This provided immediate visibility but quickly became overwhelming and cluttered as the data scaled.

To reduce the noise, I introduced hover cards to declutter the view and to display findings on demand, but this approach made it more difficult to quickly scan for insights.
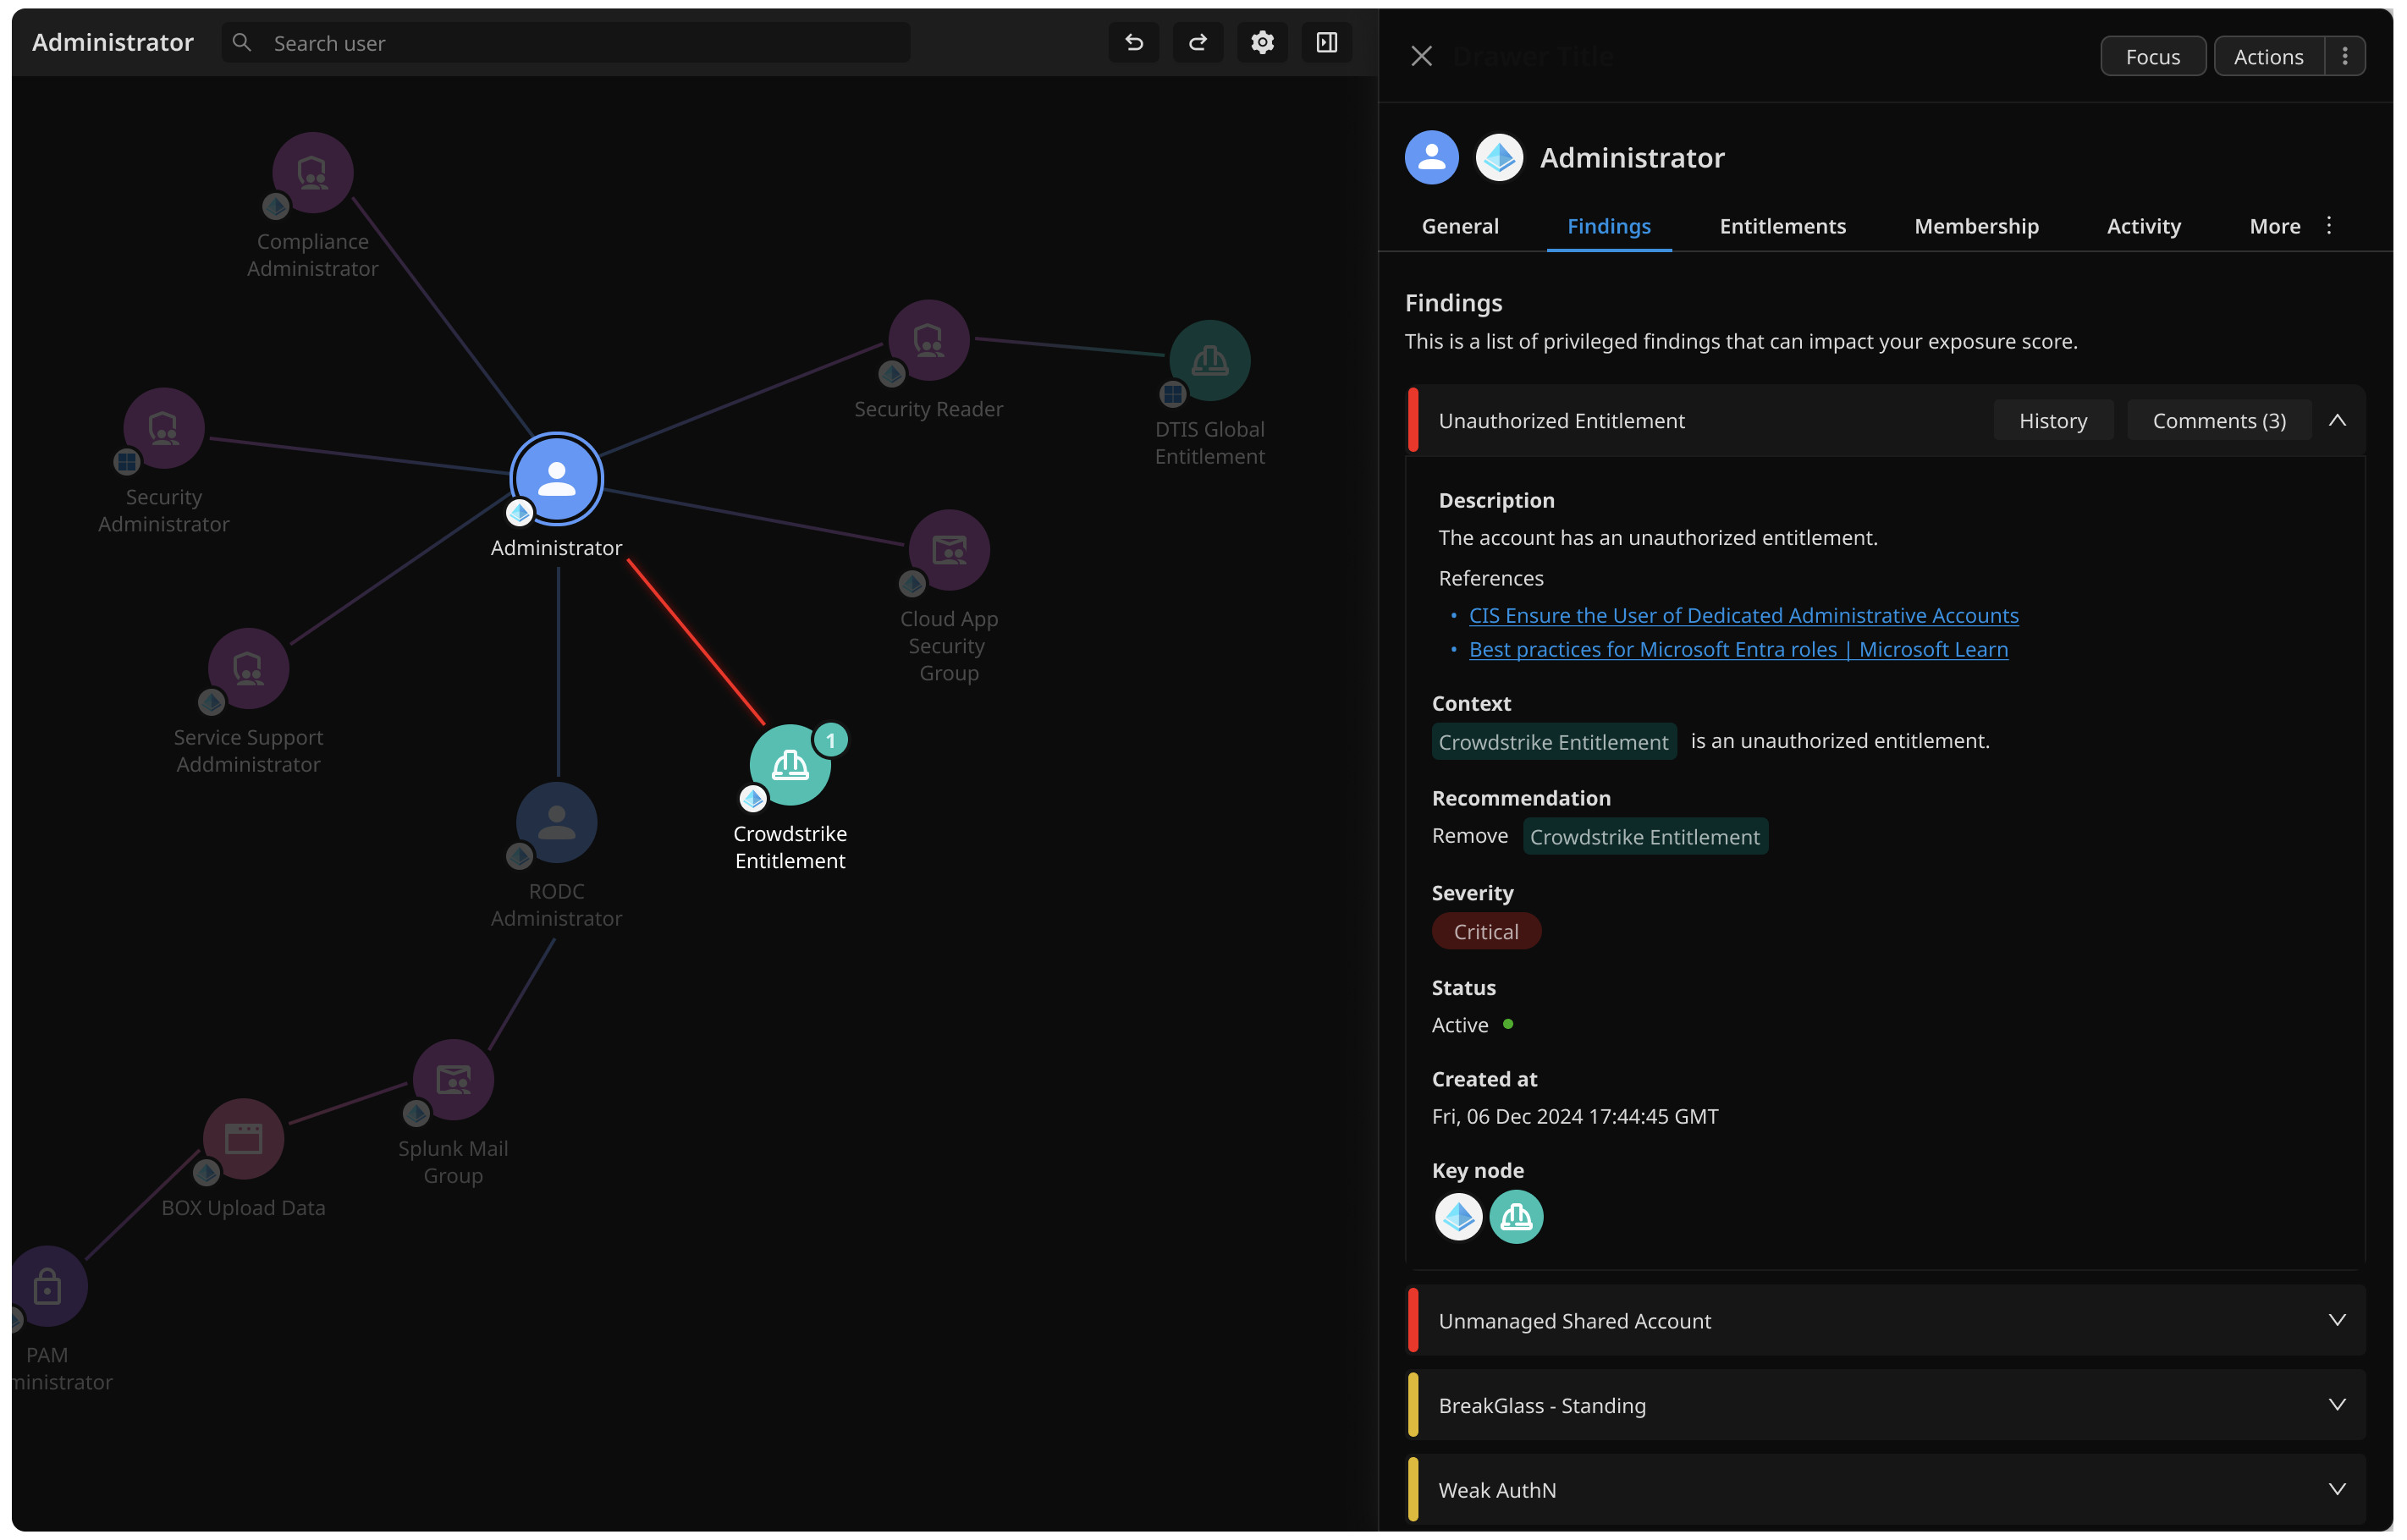
CHosen design
Click-to-reveal Findings
I finally landed on a click-to-reveal model that will allow users to explore risky issues in context without the visual overload. This also aligned with our user's mental model.
"I want to inspect this user - what's wrong with them?"


Rewind to the title
So how did I prevent Haleon, a $36-billion dollar company, from being hacked?
When showing the Identity Network graph to Paul in a call, he was able to identify an ex-employee who still had privileges in their system! Which is how I saved the company from a potential data breach and prevented them from risking millions of dollars :)
Reflection
Some learnings
Building a foundation
- I played a key role in shaping the team's initial design identity, working closely with the FE engineer to adapt Ant Design System into Ambient Security's. I managed the style guide and educated the team on design practices.
Prototyping
- I had trouble expressing how I wanted the interaction of the graph to behave as I wasn’t very familiar with prototyping and motion design. I’ve become more familiar with prototyping in Figma since then and have started to learn the basics of Rive.